 Catalogue PIGMA
/Human activities/Pollution
Type of resources
Available actions
Topics
Keywords
Contact for the resource
Provided by
Years
Representation types
-
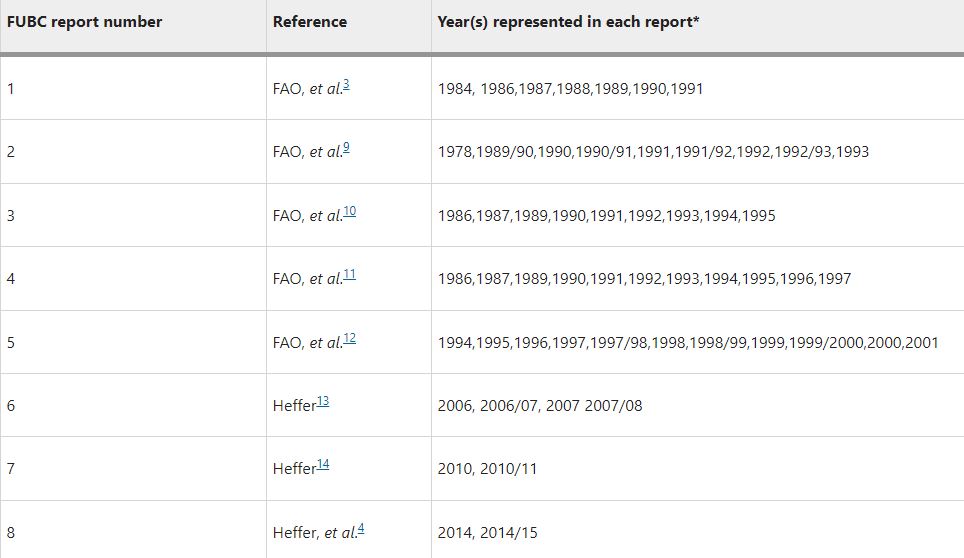
Understanding how much inorganic fertilizer (referred to as fertilizer) is applied to different crops at national, regional and global levels is an essential component of fertilizer consumption analysis and demand projection. Good information on fertilizer use by crop (FUBC) is rarely available because it is difficult to collect and time-consuming to process and validate. To fill this gap, a first global FUBC report was published in 1992 for the 1990/1991 period, based on an expert survey conducted jointly by the Food and Agriculture Organization (FAO) of the UN, the International Fertilizer Development Center (IFDC) and the International Fertilizer Association (IFA). Since then, similar expert surveys have been carried out and published every two to four years in the main fertilizer-consuming countries. Since 2008 IFA has led these efforts and, to our knowledge, remains the only globally available data set on FUBC. This dataset includes data (in CSV format) from a survey carried out by IFA to represent the 2017–18 period as well as a collation of all historic FUBC data.
-

OSPAR is the mechanism by which 15 Governments & the EU cooperate to protect the marine environment of the North-East Atlantic. OSPAR started in 1972 with the Oslo Convention against dumping and was broadened to cover land-based sources of marine pollution and the offshore industry by the Paris Convention of 1974. These two conventions were unified, up-dated and extended by the 1992 OSPAR Convention. The new annex on biodiversity and ecosystems was adopted in 1998 to cover non-polluting human activities that can adversely affect the sea. The fifteen Governments are Belgium, Denmark, Finland, France, Germany, Iceland, Ireland, Luxembourg, The Netherlands, Norway, Portugal, Spain, Sweden, Switzerland and United Kingdom. OSPAR is so named because of the original Oslo and Paris Conventions ("OS" for Oslo and "PAR" for Paris). OSPAR Data & Information Management System (ODIMS) is a fully featured platform for accessing OSPAR's geospatial maps, data and metadata. 61 Maps and 254 layers regarding: - Cables and pipelines - Comprehensive atmospheric monitoring programme - Discharges of radionuclides from the non-nuclear sectors - Discharges, spills and emissions from offshore oil and gas installations - Dumping and placement of wastes or other matter at sea - Environmental monitoring of radioactive substances - Fishing for litter - Vulnerable marine ecosystems - etc.
-
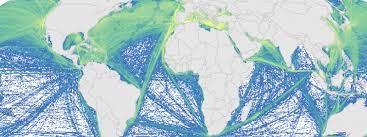
This is a portion of the data used to calculate 2008 and 2013 cumulative human impacts in: Halpern et al. 2015. Spatial and temporal changes in cumulative human impacts on the world's ocean. Seven data packages are available for this project: (1) supplementary data (habitat data and other files); (2) raw stressor data (2008 and 2013); (3) stressor data rescaled by one time period (2008 and 2013, scaled from 0-1); (4) stressor data rescaled by two time periods (2008 and 2013, scaled from 0-1); (5) pressure and cumulative impacts data (2013, all pressures); (6) pressure and cumulative impacts data (2008 and 2013, subset of pressures updated for both time periods); (7) change in pressures and cumulative impact (2008 to 2013). All raster files are .tif format and coordinate reference system is mollweide wgs84. Here is an overview of the calculations: Raw stressor data -> rescaled stressor data (values between 0-1) -> pressure data (stressor data after adjusting for habitat/pressure vulnerability) -> cumulative impact (sum of pressure data) -> difference between 2008 and 2013 pressure and cumulative impact data. This data package includes 2008 and 2013 raw stressor data. The 2008 data includes 18 raster files (preceeded by raw_2008_). The 2013 data includes 19 raster files (preceeded by raw_2013_). There is no sea level rise data for 2008.